Salesforce recently announced the general availability of their own code analyzer tool, which brings popular code quality scans to the local development environment, including
- PMD: Provides rules for static analysis of code written in a number of supported languages, including Java, Apex, and Visualforce
- ESLint: Evaluates Salesforce Lightning Web Components and Typescript
- RetireJS: Analyzes a project’s third-party JavaScript dependencies and identifies security vulnerabilities
- Copy/Paste Detector (CPD): Identifies blocks of duplication across files
- Salesforce Graph Engine: Used data flow analysis to provide advanced detection of security and quality issues in code
In previous posts, we looked at how to set up SonarCloud code analysis for Salesforce in a CI/CD pipeline, as well as how to “shift left” and use SonarLint to bring the Sonar analysis directly into VS Code.
SonarLint already provides many of the capabilities of Salesforce Code Analyzer, but there are a few reasons why you might want to consider utilizing Salesforce Code Analyzer instead:
- Salesforce Code Analyzer is simpler to set up locally as we will see shortly. Utilizing SonarLint requires connecting your local project or VS Code workspace to Sonar Cloud, which is a bit more complicated to set up and, in my experience, requires some ongoing effort to maintain the connection.
- Code Analyzer includes Salesforce Graph Engine, which offers advanced scanning capabilities through the use of data flow analysis making it possible to catch harder-to-identify issues, such as null pointer exceptions and security vulnerabilities.
In this post, we will look at how to install and use the Salesforce Code Analyzer.
Prerequisites
- Salesforce CLI, Salesforce extensions for VS Code and related dependencies installed and configured on your machine. See step-by-step instructions for setting up Salesforce development on Windows machines.
- Salesforce org with the DevHub feature enabled (developer or enterprise and up). Sign up for a free developer edition org here.
Install Salesforce Code Analyzer
Install Salesforce Code Analyzer
sf plugins install @salesforce/sfdx-scanner

# Verify the installation
sf plugins
Install the Salesforce Code Analyzer VS Code Extension and reload VS Code if necessary.
Using Salesforce Code Analyzer Features
Open a project in DX format with VS Code.
Start a scan by right-clicking a file or folder and selecting the option SFDX: Scan selected files or folders with Code Analyzer. You can also open a file and use the command palette to start a scan of the open file.
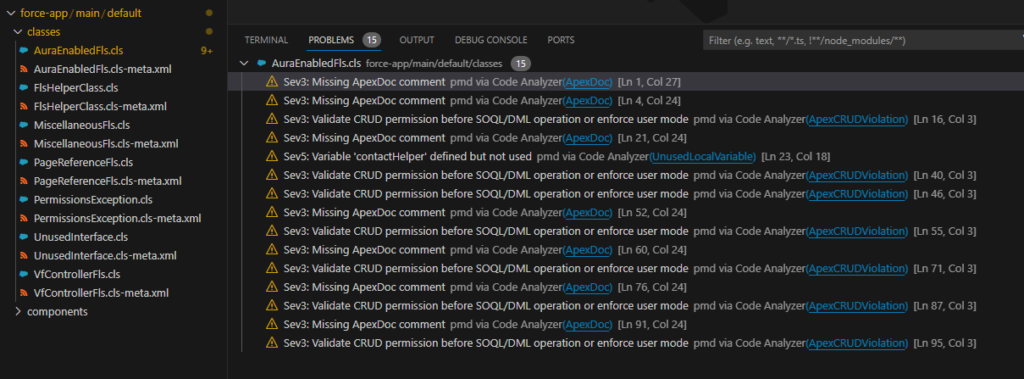
The Salesforce Code Analyzer extension for VS Code displays issues in the Problems pane.
Review highlighted issues in the editor by hovering over code with yellow underline
You can also export a report of all issues in the project with the following command
sf scanner run --format=csv --outfile=CodeAnalyzerGeneral.csv --target="./"After resolving the issues, run the scan again to clear out the warnings.
Summary
This post covered how to use the Salesforce Code Analyzer in VS Code to view Apex and JavaScript scan results in the local IDE. The tools are provided by a plugin to the Salesforce CLI and a VS Code extension. While the tooling is still in early development, they show promise and are worth trying out.
Resources
- Documentation: Salesforce Code Analyzer Command Reference
- VS Code Extension: Salesforce Code Analyzer
- Source Code: Salesforce Code Analyzer Project


