A few years ago, I created a series of posts that explored the capabilities and limitations of various data visualization tools when embedded in Salesforce. Since then there have been some exciting updates to Tableau Online as well as to the native integration capabilities between Salesforce and Tableau.
This post is an example of how to use a lightning web component to display and filter a Tableau Online dashboard on record pages in Lightning Experience.
Prerequisites
- Access to Tableau Online or Tableau Server: you will need an environment where you can create and host the Tableau dashboard online.
- Salesforce org populated with data you want to visualize; the example below uses data from the account and opportunity objects. You can create a free developer edition org that is pre-populated with data using this link.
- Optional: if you intend to use the open source component code, you will need the Salesforce CLI to deploy the component to your Salesforce org
Step 1: Create Dashboard in Tableau Online
Navigate to Explore -> Default project and create a new workbook.
In the Connect to Data screen, select the Connectors tab and select the Salesforce connector. Enter your credentials for the Salesforce org.
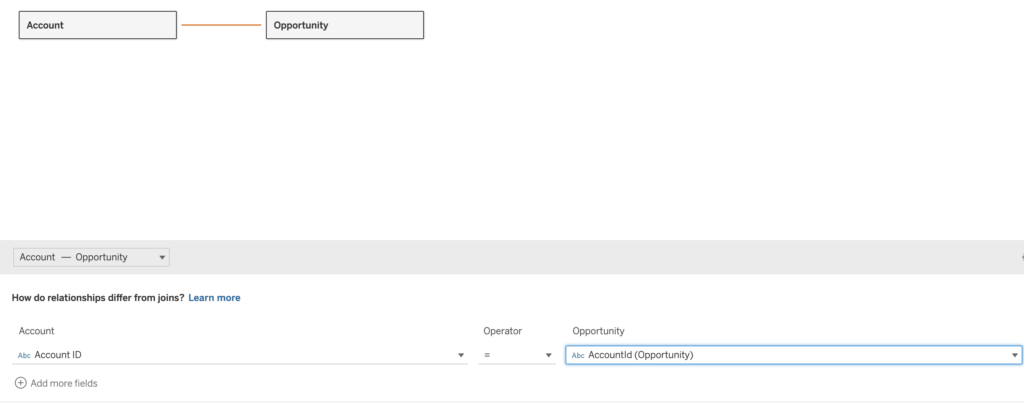
Tableau will create a new workbook and open the Data Source tab. Drag the Account table onto the canvas and then the Opportunity table onto the canvas. Click the line between the tables and in the lower pane set Account Id = AccountId (Opportunity) to define the relationship.
Navigate to the Sheet1 tab to begin exploring the dataset. Tableau Online will automatically extract the data based on the tables we selected.
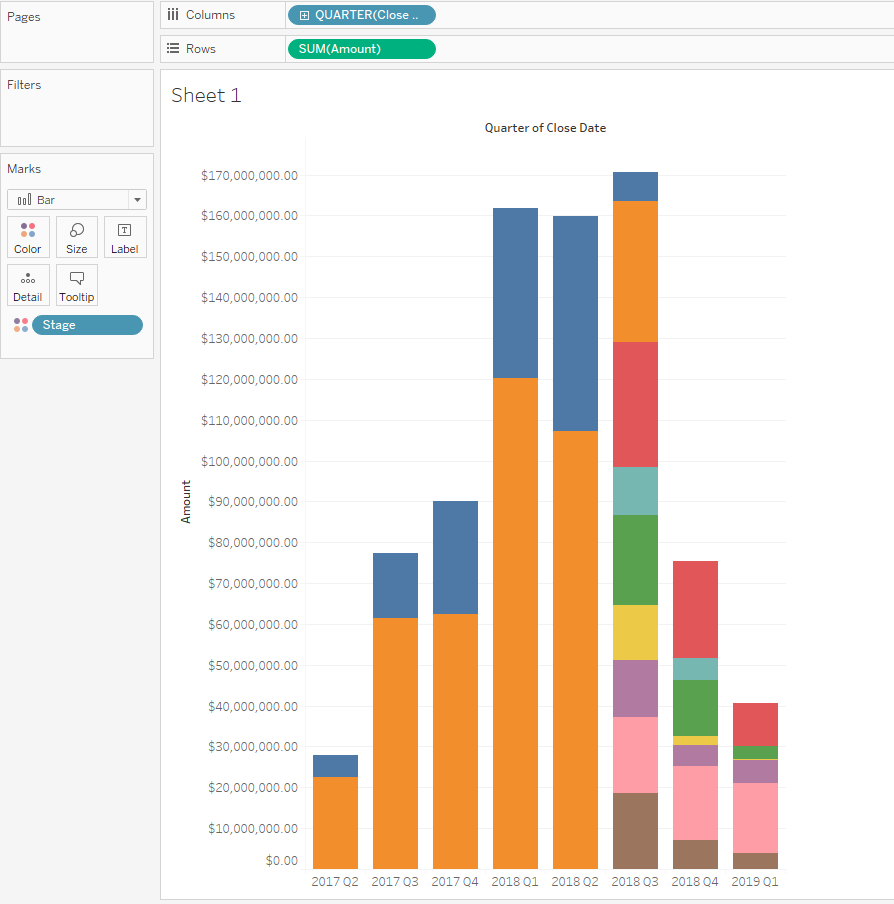
Lets create a basic visualization of the data. Drag Opportunity Close Date to the Columns pane and drag Opportunity Amount to the Rows pane. Click the carrot on the right of the Year(Close Date) bubble and change the grouping to by quarter and year.
Drag Opportunity Stage to the Marks pane and drop on top of the “Color” icon.Change the chart type to stacked bars. Your chart should look something like this
Let’s create a few filters. Drag the Opportunity Stage dimension onto the Filters pane. In the popup, deselect the “Closed Lost” option to remove lost opportunities from our pipeline. Drag the Id (Account) dimension onto the Filters pane. Select the filter and choose Apply to Worksheets -> All Using Related Data Sources. We will reference this filter when we embed the dashboard.
Create a dashboard by clicking on the New Dashboard icon next to the active worksheet. Drag the worksheet onto the dashboard and save the workbook. On the dashboard sheet, update the Size pane to “Automatic” so that the dashboard size will adjust to the fill the window used to display it.
Click the “Publish As…” button and give your workbook a name.
Close the workbook editor and return to Tableau Online. Navigate to and open the dashboard in view mode. Click the Share icon in the header and copy the link in the “Share using a link” box.
Step 2: Install the Tableau Viz Lightning Web Component
The easiest way to install the Tableau Viz Lightning Web Component is by installing the package from the Salesforce AppExchange.
The component is also available as open source code and can be installed by cloning the repository and deploying to your org. Instructions for installing with this approach can be found in the repository’s readme. This is especially usefully if you want to customize the component.
Step 3: Embed Visualization in Salesforce Lightning Experience Records
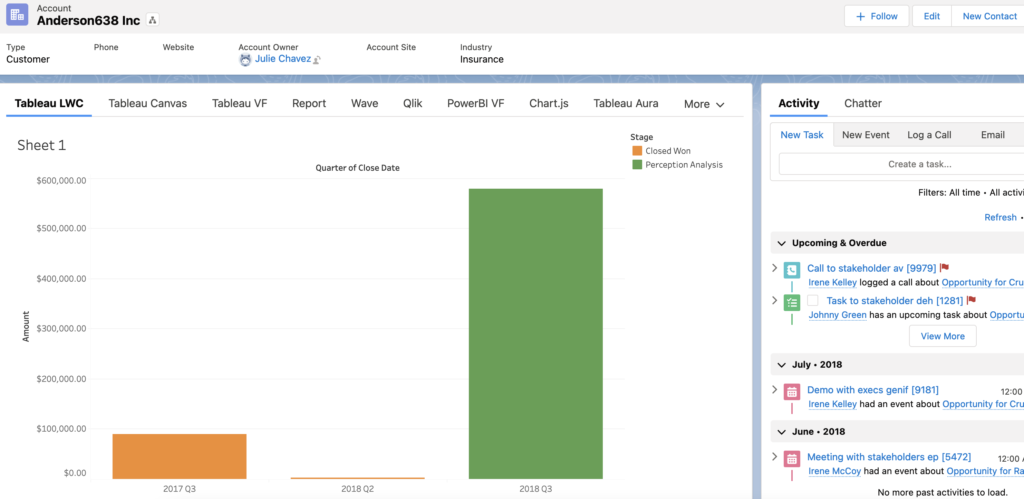
Now we need to customize the Account record page to show the dashboard. Navigate to an Account record in your Salesforce org. Click the gear icon in the top right and select “Edit Page”. This will open the Account Record Page editor in the Lightning App Builder. Click the Tabs component, then the Add Tab button. Select “Custom” for the Tab Label and enter “Tableau LWC” for the Custom Tab Label.
Click the Tableau LWC tab, then drag Tableau Visualization component from the list of components onto the page.
In the component configuration pane, make the following updates
- Paste the share link copied at the end of Step 1 into the “The Tableau URL for the view”. Check the box
- Check the box “Filter the Tableau View based on the Salesforce record”
Save the updates to the page and return to the Account record. You will have to manually sign in until you set up SSO between Salesforce and Tableau Online/Server.
Summary
Advantages of this approach include:
- Effort and skills required: Tableau Online/Server is a robust tool and harder to learn than Salesforce reports and dashboards, but definitely very accessible. If you are savvy with Excel or other data manipulation tools, you’ll pick it up quickly. This approach does not require knowledge of front end development technologies.
- Multiple devices: Tableau Online/Server provides a number of features for design responsive layouts when creating the dashboard. This needs to be specified in Tableau, rather than in the Salesforce application. Custom record page tabs can also be created for the mobile layout.
- Look and feel: There are a lots of chart types and options for customizing the styling and layout of charts and dashboards. This seems to be one of the key differentiators for Tableau.
- Large data volumes: Tableau Server/Online can handle very large data volumes.
- Data sources: Tableau supports many connectors to various data sources and data formats. This is a particular strength of Tableau.
- Data model: Tableau provides robust functionality for restructuring and enhancing the data model to support visualization needs.
There are some limitations with this approach
- Accuracy of data: The flip side of being able to handle very large data volumes is that the data is not queried from the CRM in real-time. Data in Tableau visualizations are typically updated up to every 15 minutes so embedded visualizations may not be totally accurate, but might be close enough for your requirements. Note that it is possible to update visualizations with real-time connections to data sources but is generally not recommended due to performance issues.
- Single sign-on: Assuming you do not already have SSO at your organization, this simple approach requires Salesforce users to log into Tableau Server/Online separately in order to view visualizations. However, it is fairly simple to set up SSO from Salesforce to Tableau Online/Server using Salesforce as the identity provider
- Data security: Tableau typically aggregates data from source systems into a new data set within Tableau and any Salesforce data security settings, such as object and field level security and record-level sharing, are not transferred by default. If your data security model is pretty open, this might not be an issue. For other scenarios, especially embedding in external-facing application pages, re-creating the field and row-level security in Tableau could be a significant effort.
- Deployment process: Source data, worksheets and dashboards are developed and published in Tableau Server/Online and live separate from the Salesforce platform. The process for creating/updating embedded assets needs to be coordinated with the process for creating/updating the application page in which they are embedded.
Resources
- Trailhead: Embed Tableau Visualizations in Salesforce
- Open Source: Tableau Viz LWC
- Tableau Documentation: Embed Tableau Views into Salesforce


