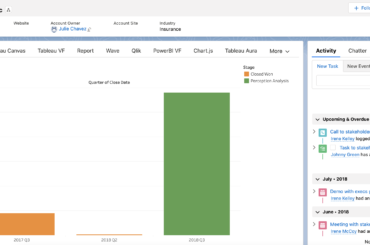
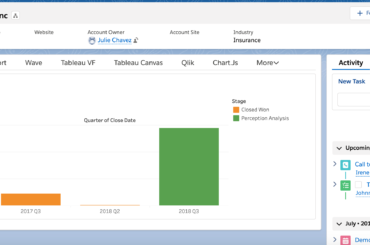
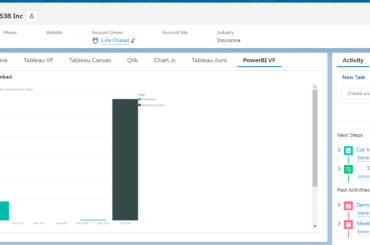
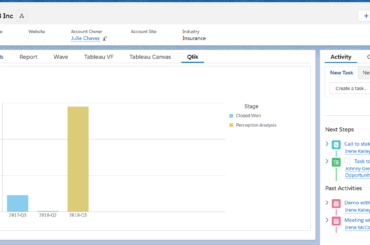
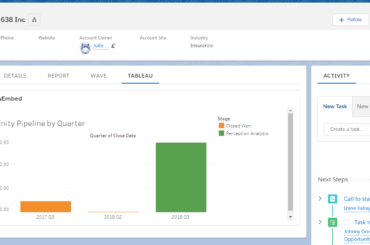
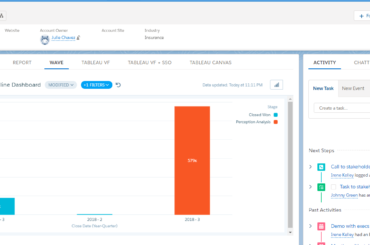
A few years ago, I created a series of posts that explored the capabilities and limitations of various data visualization tools when embedded in Salesforce. Since then there have been some exciting updates to Tableau Online as well as to the native integration capabilities between Salesforce and Tableau. This post […]
Tag: Embedded Analytics
Summary of Embedded Analytics for Salesforce at Dreamforce ’19
I wrapped the series of posts about how to embed visualizations in Salesforce applications with a Wednesday architect session at Dreamforce ’19 and a repeat architect session on Thursday comparing the various options. Before diving into the content, I shared some of the use cases at Fair Trade USA. The […]
Embed Tableau Dashboard in Salesforce Records Using JavaScript API
UPDATE 2021: The recommended approach for embedding Tableau visualizations in Salesforce Lighting Experience is to use the Tableau Viz Lightning Web Component. This post is part of a series that is exploring the capabilities and limitations of various data visualization tools when embedded in Salesforce. This is an example of […]
Embed Power BI Report in Salesforce using Visualforce
This post is part of a series that is exploring the capabilities and limitations of various data visualization tools when embedded in Salesforce. In the previous post, we used Qlik Sense to embed a dashboard on an Account record. Qlik Sense is a great product, but if your organization is […]
Embed Qlik Sense Dashboards in Salesforce Records
This post is part of a series that is exploring the capabilities and limitations of various data visualization tools when embedded in Salesforce. This is an example of how to use Qlik Sense Desktop to display and filter a Qlik visualization on record pages in Lightning Experience. Prerequisites Qlik Sense […]
Embed Tableau Dashboard in Salesforce Records Using an iframe
UPDATE 2021: The recommended approach for embedding Tableau visualizations in Salesforce Lighting Experience is to use the Tableau Viz Lightning Web Component. This post is part of a series that is exploring the capabilities and limitations of various data visualization tools when embedded in Salesforce. In the previous post, we […]
Embed Einstein Analytics (Tableau CRM) Dashboard in Salesforce Records
UPDATE: Einstein Analytics was renamed to Tableau CRM in 2020 This post is part of a series that is exploring the capabilities and limitations of various data visualization tools when embedded in Salesforce. In the previous post, we used native Salesforce report charts to embed a visualization on an Account […]
Embed Report Chart in Salesforce Records
This post is part of a series that is exploring the capabilities and limitations of various data visualization tools when embedded in Salesforce. This is a look at how to use native Salesforce reports to display a visualization on record pages in Lightning Experience. Prerequisites Salesforce org populated with data […]
Embedded Analytics for Salesforce Applications
One exciting trend over the past several years has been an increase in integrating visualizations and content from analytic tools into web applications to deliver insights to users in the application where they need to take action on those insights. We are going to work with several leading analytics solutions […]
